The DNA results are in and they confirm that we have found the sperm donor, my late husband’s second cousin once removed. This cousin now has 8 children instead of none. Back then, donors were promised anonymity, but DNA testing has changed that; if their close family or cousins have done DNA testing, then it is likely that they can be identified. Continue reading
Archives
Interesting New DNA Features at Ancestry
Do you know that Christa Cowan, Ancestry’s Barefoot Genealogist, posts Youtube videos every month describing new features? The changes that a number of readers have asked about were described in her June video. First of all there are some new DNA communities so go have a look at your ethnicity breakdown. These are based on some of the other 20 million DNA testers and their trees on the Ancestry site.
The other new item of interest is a change to the match list page. You are now asked if you know who your matches are. Some long-time users find this annoying, but it gives you a nice way to separate paternal and maternal matches when your parents are not both tested. It also lets you specify a specific relationship which is then listed for that person. Christa describes that feature about ten minutes into her June “What’s New at Ancestry” video below.
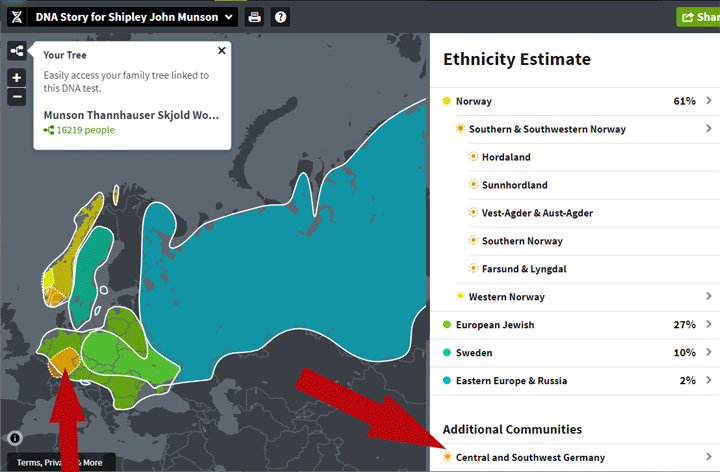
Those of us with German ancestry are excited by the new breakdown of those communities. Click here for Ancestry’s blog post about German DNA. My maternal grandmother was born in Munich to Bavarian Catholic parents. Apparently my brother got more of her DNA than I did, since I have much more from our Jewish maternal grandad: 34% as compared to Shipley’s 27% plus I get a Jewish community and he does not. By the way his Ashkenazi used to be only 22% and that is close to what both 23andme and MyHeritage find. To further investigate this, we convinced a Catholic half second cousin in Germany to do a DNA test. This was additional confirmation of our uneven maternal DNA inheritance, click here for that post.
This is the image of my brother’s latest ethnicity results which now include “Central and Southwest Germany” so perhaps Bavaria – red arrows are my addition. By the way, clicking on a community will not only tell you more about that history but will show you those matches who share it.
Our father was 100% Norwegian in descent so my brother’s extra 10% Norwegian must be German. My Norwegian has now risen to 49% which pleases me. That plus the 1% Finnish are presumably from my dad.
Many users are starting to see the question “Do you recognize them? “ next to matches on their DNA relatives list with a Yes button and a Learn More button underneath.
Continue reading
A Nice New Feature at DNApainter.com
One tool I use all the time at the DNApainter site is the online shared cM calculator. This shows you the possible relationships that you have to a DNA match based on either the shared centimorgans (cM) or the percentage of DNA shared. It uses both the calculated odds from the DNA geek and the observed odds from Blaine Bettinger’s shared cM project. I find that these are far more useful than the predictions at the various testing companies.
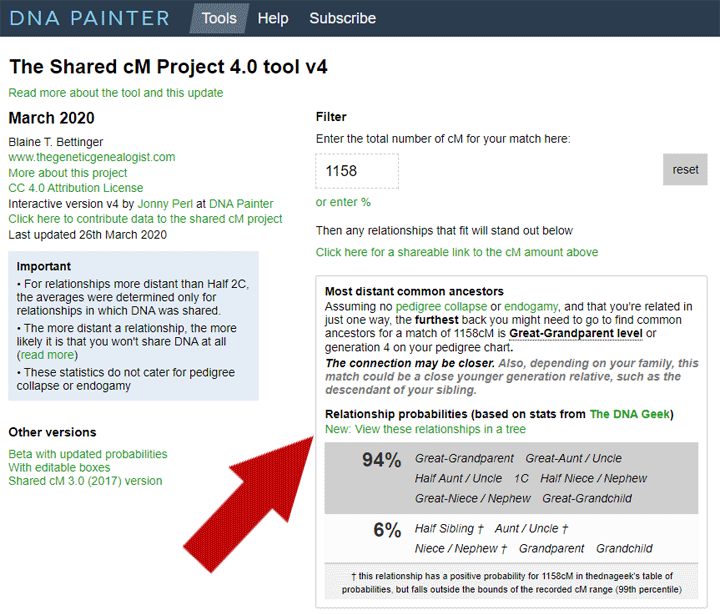
When you input a number in the box at the top under the word Filter, you get a display like the one above which shows the likelihood of various relationships. Additionally those possibilities have their boxes light up in the chart underneath (click the image for the larger version which shows that). I used the 1158 cM that my first cousin “C” shares with me, on the high end for that relationship, to see what would show.
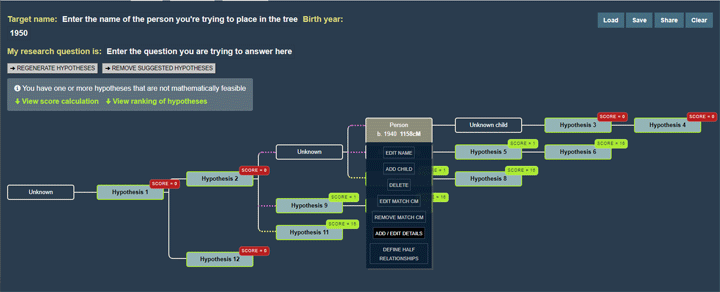
Do you see my red arrow pointing to the new feature? When you click on the words View these relationships in a tree you get a diagram like the one below, showing possible places for you in the tree of your match. Quick tip, right click those words to get a little menu from your browser letting you open it in a new tab or window. This diagram is created by the WATO (What Are The Odds) tool.
One thing that takes getting used to for many of us genealogists, is that WATO uses a backwards pedigree format, a sideways descendant tree. The presumed common ancestor is on the left and the descendants fan out on the right. Every person in this diagram can be edited by the way. You can add names, birth years, whether they are half relationships, and so on.
Most people like visual displays of relationships so it is great to see the possibilities laid out in a family tree. Click the Continue Reading below for my experiments with some of my known cousins. However you may prefer to read about the details of this new tool by its author, Jonny Perl, on his blog (click here) – he does a great job of explaining it.
Also to learn more about WATO, click here for the Family History Fanatics youtube video or click here for Leah Larkin’s many more advanced articles on WATO.
More DNA news and a virtual conference
It has been two months since my husband died and I am still not back but there is so much interesting genealogy and DNA news that I am making the effort to blog today. Forgive my lack of original thought; my brain is not working well yet, other widows call it “grief brain.”
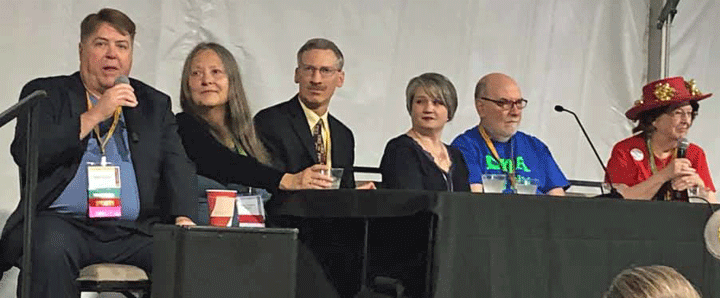
DNA expert panel at the 2019 SCGS Jamboree: L to R: Brad Larkin, me, Tim Janzen, Angie Bush, David Dowell, and the organizer Alice Fairhurst
First of all, my favorite local conference, the Southern California Genealogical Society Jamboree has been restructured as a two weekend virtual event. This coming Friday and Saturday are about DNA and yes I managed to record a talk on finding cousins which explains some of my favorite techniques at the major sites. Next weekend is the Genealogy portion, again on Friday and Saturday. Plus, as always, there are some free events; for example, Monday next week has virtual round tables and I will be hosting one. Click this URL for more information about all this conference: genealogyjamboree.com
Next, MyHeritage has been doing some exciting things with your old photos. The latest is automatic repair. I am eager to try it. Previously they added colorization and automation. Click here for the blog post on the new magic photo repair tool
23andme has come out with an interesting report on the genetic basis for why some people lose their sense of smell with COVID. Click here to read it (it requires you to log in)
Finally GEDmatch has released their updated prettier site. You have the option to use the new site which still has a few small bugs or the old, familiar, but clunky site. Yes the changes are mainly cosmetic and making help more available. As soon as I have some energy I will blog about them. In the meantime be sure to try the new site and send bug reports to support@gedmatch.com
DNA Day and some DNA News
Sunday April 25 is DNA Day. Every major company is having a sale to celebrate. Family Tree DNA is even having sales on the upgrades to their various Y tests. This is a great opportunity to get that done. Click here for their price list.
Click the image below for a very interesting post on the history of DNA day from the 23andme blog.
There has been much exciting news in the genetic genealogy world while I was away (I still am on a break). So here are some of the announcements you might want to read about.
- GEDmatch has collaborated with Genetic Affairs to improve their clustering tools and to include auto-tree building. Click here for that news release. The next blog post I intend to write will evaluate these.
- DNApainter is sending out a free monthly newsletter, the most recent had information about a couple of new releases. Go to that site and click the green banner at the top of the homepage to sign up if you’re interested.
If you haven’t tried Deep Nostalgia, the new tool to animate family photos at MyHeritage, maybe click here to read all about it.
Ancestry has reorganized their Match list page. More of your notes will now show up since they have been moved to be below each match.
