One of the most unusual talks at the recent i4GG conference (videos coming soon) was the one about the use of AI for genealogy by Steve Little, the AI program director for the National Genealogical Society (NGS). I learned that it was how you phrased your question that could lead to more accurate answers, e.g. “you are a professional genealogist … ” I found out that AI, particularly the paid versions, could extract text from documents, even handwritten ones and translate in context. Here is my favorite slide from that talk. Personally my first impression of ChatGPT had been that it was great at sounding good while making stuff up.
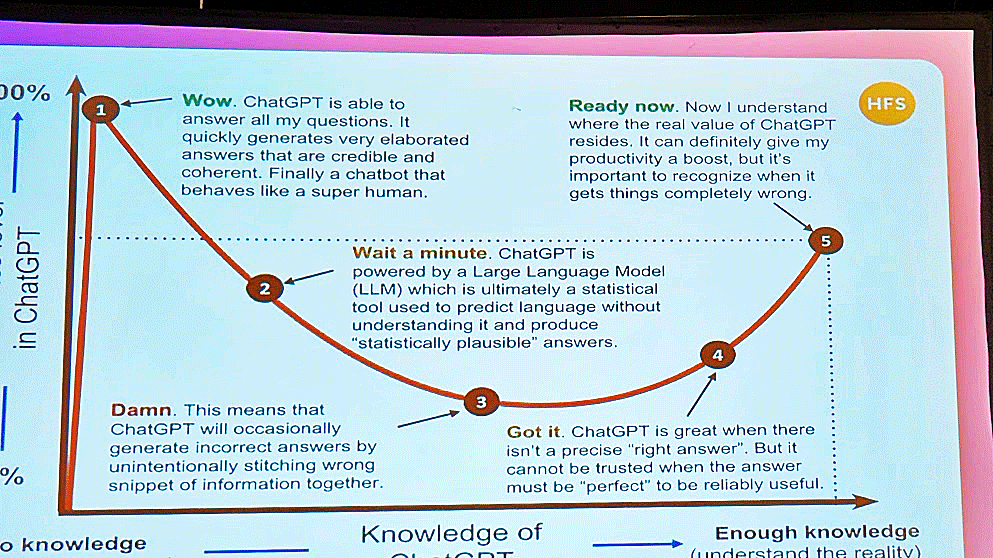
Slide from Steve Little’s talk, used by permission
Steve will be speaking at RootsTech at 8 am Thursday this week and will also be available at the NGS booth as per his post on FaceBook.
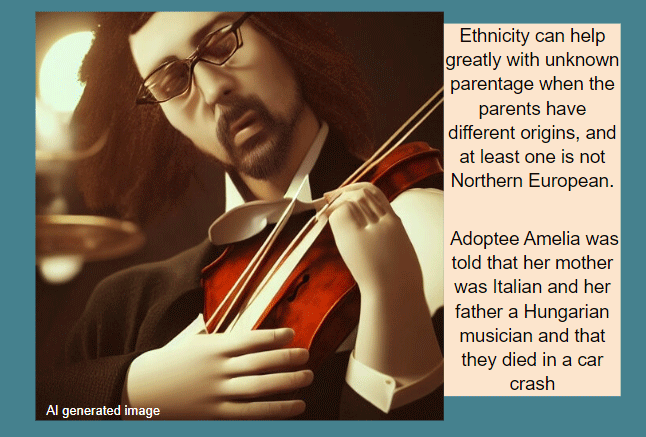
Amusingly, in my own talk about using bioancestry to solve unknown parentage cases, I had experimented with using AI generated images to illustrate a few of my points. For example, when I asked the deepAI image generator for a Hungarian violinist I got this image whose hands are imperfect, but it still adds pizzazz to the slide.
No sooner has my favorite DNA conference (i4GG) ended, than it is time to get ready for Rootstech! No I won’t be there in person this year, too much to do to prepare for our move to Connecticut. Hope everyone has a great time. I will attend virtually, so if you are logged in there, you can click here to see if you are related to me! As all my ancestors are fairly recent immigrants (earliest 1860s), I have only 434 relatives at Rootstech, the closest being a fifth cousin. Oh well.