 Both Ancestry and FamilyTreeDNA have recently updated their ethnicity results. As much fun as it is to look at your ancestry composition, those estimates do not really reflect the populations of today’s countries, but rather human migrations hundreds of years in the past. Therefore the big picture is more accurate than the smaller areas. Examples that I have found to be realistic are North versus South Europe or East versus West versus South Asia.
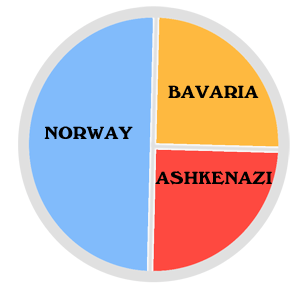
To the left is a simple pie chart showing the known ancestry for my brother and myself for the last 300 years or so. Our father was Norwegian American, documented back to the 1600s, and our mother was born in Munich to a Jewish father and German (Bavarian) mother. In 2016 I wrote a blog post showing how my brother’s ethnicity appeared at a number of DNA companies and third party sites (click here for that post). This post will look again at the ethnicity predictions for each of us from the main testing companies.
One thing I always find interesting is that they all show my brother Shipley with less DNA from our Jewish grandfather than I have. The variations between full siblings can be quite large.
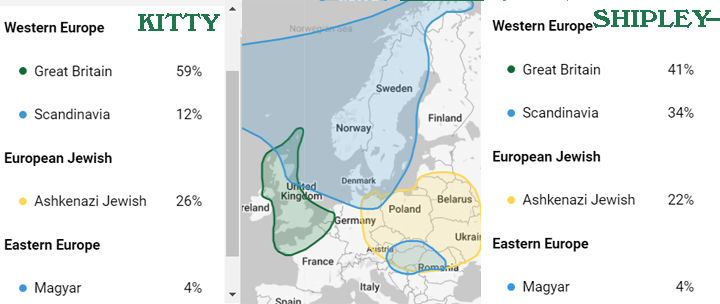
Let’s look at the new Family Tree DNA results first:

My Origins at Family Tree DNA for my brother and myself
Nice and simple but not very accurate. We have no British ancestors in the last 500 years that we know of. However there is no such thing as German DNA because that area was a crossroads. It usually shows up as French, Scandinavian, British, or even Eastern European. Jewish DNA is quite distinct due to centuries of endogamy. Interestingly, our Jewish never comes out at the expected 25%. All the companies show me with more than that and my brother with less. Although you inherit half of your DNA from each parent, they do not have to pass you an equal amount from each of their parents.
Here are our results at MyHeritage:

Our ethnicity predictions at MyHeritage
MyHeritage is an excellent site for working with your DNA since it includes a chromosome browser that shows triangulations and it also looks through user trees to try and figure out your relationships to your DNA cousins. However, although their ethnicity estimates have improved over time, like Family Tree DNA, they incorrecty find lots of British Isles DNA for us. They call it Irish, Scottish, and Welsh. The Jewish component is only few percentage points different from Family Tree DNA.
Frankly I find the estimates at 23andme and Ancestry more accurate.
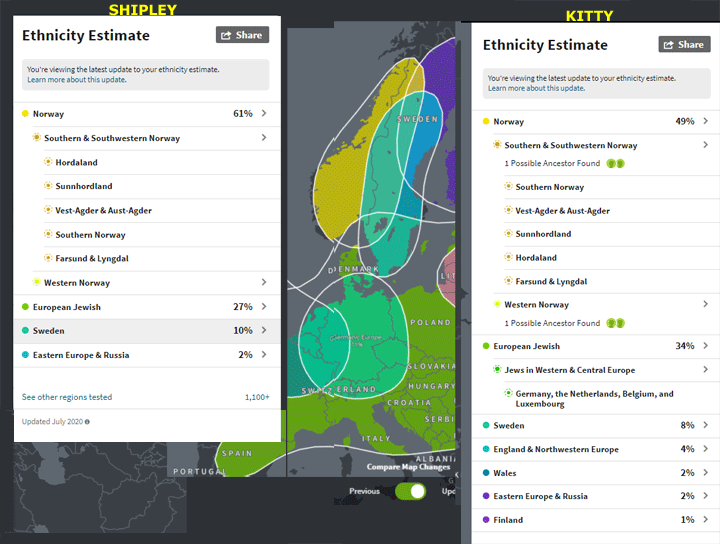
In September, I wrote a blog post (click here) showing the changes at Ancestry where my brother and I lost all our “Germanic tribes” and gained some Jewish and more Norwegian. Here is the Ancestry image for both my brother and myself. Finally we are close to having the known 50% Norwegian! I like how they relate the results to your actual tree. The area breakdowns within Norway are quite accurate although the Telemark and Vestfold counties in Eastern Norway are missing, perhaps they fall into the general category of Southern Norway.
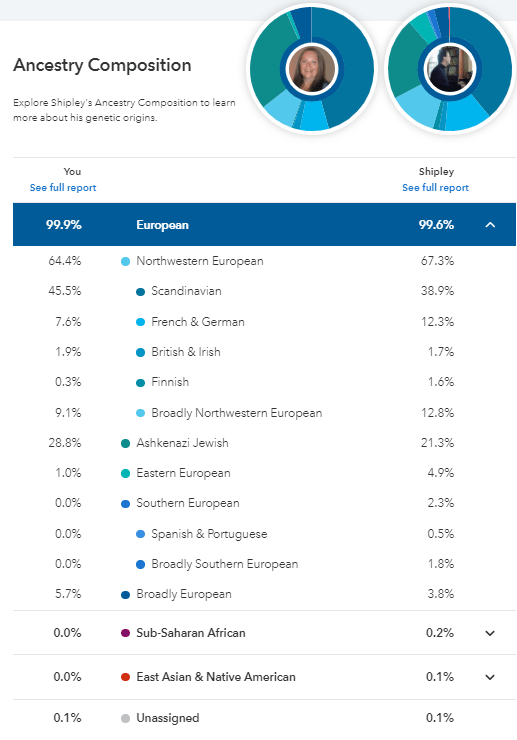
Here is the image from 23andme comparing me and my brother. I am always amused by the .1% Native American since we know we have none. Frankly anything under 1% is to be viewed with suspicion. 23andme will also show the ethnicity breakdown by segments on each chromosome which is one of my favorite features there.
Finally the admix utilities at GEDmatch are quite interesting, but are unchanged since that 2016 post. In fact they are mainly unchanged since a presentation I gave about using them in 2014 (click here for those slides)
In my experience, predicting the ethnicity for people of Northern European heritage like my brother and myself, is very hard to do accurately because there was so much mixing of those populations.


If you take Scandinavian from 23&Me, at about 45% and 40%,
Norway + Sweden from Ancestry, at about 57% and 71%
Scandinavian from MyHeritage, at about 43% and 51%
And Scandinavia at FTDNA, at about 12% and 34%
(Did I get these right?)
It seems MyHeritage and 23&Me have you both around 40-50%, Ancestry higher by about 20% peak, and FTDNA low by about 30% peak. Meaning the 71% and 12% look like outliers. (Though this is hubris since the distribution is ridiculously small).
The 23&Me French and German category looks factor of 2 or more too small.
Looks like confidence is low everywhere, but I suppose using just this comparison, 23&Me and MyHeritage look best to me… what do you think?
Jim –
I like Ancestry for the connection to specific areas and trees and 23andme for the extra tools. Personally I do not worry too much about the predictions. I view them as interesting but not yet solid science.
Here is a good article about ethnicity on the Ancestry blog. I am not sure how old it is but it is pretty good:
https://www.ancestry.com/lp/ethnicity-estimate/reading-your-ethnicity-estimate
Here is a recent link to an Ancestry blog post about their ethnicity estimates
https://www.ancestry.com/corporate/blog/ancestry-delivers-more-precise-ethnicity-estimates-powered-by-the-worlds-largest-consumer-dna-network
Hi Kitty,
Thanks for your most recent post, and in staying up to date on everything DNA-related. I have to say that I was greatly surprised when back on the 2nd, I noticed that my FTDNA Origins results had changed. Now I was apparently 19% Magyar, which I knew was the main ethnic group of Hungary. The thing was/is, that I am three quarters Italian/Sicilian by heritage, the rest apparently being Irish, English, French, and possibly Norwegian. I was excited in some odd way, but also perplexed. Why would an insular ethnic group with almost no ties to the Italians, the French, or the Slavs end up under my results, or anyone’s results that wasn’t Hungarian?
Well when I looked into the Magyar invasions of the 10th century, it seemed as though the Magyar tribes went just about everywhere in Western Europe. Germany, France, Italy, and Spain were invaded by the Magyars, just as Ireland and England were heavily invaded by the Norwegian vikings and the Danes. It got me to thinking…if the Vikings could alter the genetic compositions of eastern Ireland, northern Scotland, and eastern England, who is to say that the Magyars couldn’t have done the same in Italy/Germany/France?
There is another “potential” factor as well. In Edward James’ book Europe’s Barbarians, I remember him talking about how all the tribes that invaded Italy and the Roman empire in general, were greatly genetically diverse. The Goths for example were ruled by a mostly Germanic aristocracy at the top, but most of the “rank and file” were apparently Slavic peoples, escaped Roman slaves who were presumably of Meditteranean heritage, and other various groups from Eastern Europe. Now if the Lombards and the Goths mixed with any Magyars during their time in Eastern Europe, it may be a new plausible explanation as to why modern Italians have Magyar DNA??
But honestly, I’m interested in seeing what anyone else thinks of these possibilities. Thanks for reading — Bill G
I saw a post on FaceBook somewhere that they had recently received a Magyar reference population of about 300 people which may be why we are all now seeing that group.
This link shows the populations ftDNA has in their new groupings
https://learn.familytreedna.com/family-finder-autosomal-testing/myorigins-family-finder-autosomal-testing/myorigins-population-clusters/
I have a friend that is 100% Hungarian but according to FTDNA he is 0% Magyar. Whereas I, with one great-grandmother, am 2% Magyar according to them. It’s really kind of funny
Hi Kitty,
Is it possible to have 1X great grandparents to be documented on US census records as being Jewish from Germany & your DNA show NO trace of Jewish ancestry? Also this person’s paternal grandmother told her grand kids that she was Cherokee Indian, but the family missed getting documented on the Dawes Rolls. Her DNA shows NO trace of any Native American. The only non European was 1% or less Caucasus DNA.
Looking forward to your thoughts on this. Local San Diegan here.
Thank you so much 🙂
Andrea –
There is a chart on this page at the ISOGG wikki which shows the probability of inheriting no DNA from various levels of great grandarents.
https://isogg.org/wiki/Cousin_statistics
There is a tiny chance for 3 and 4x great grandparents but no chance to get no DNA from 1x. Possibly those great grandparents were recent converts so show no Jewish in their DNA but more likely they were not Jewish or not the great grandparents. Find other descendants from that couple and see if they are a match
As to the Cherokee, this is a family fable told to many. Try this article for some background on that
https://slate.com/news-and-politics/2015/10/cherokee-blood-why-do-so-many-americans-believe-they-have-cherokee-ancestry.html
Hi Kitty,
Thank you so much for your response. It’s actually what I thought it would be, so no surprises.
Thank you!
Andrea,
I’d be happy to share some of my experience in tracing my Cherokee lineage.
This is a really good write up about having native American DNA from 23andme https://blog.23andme.com/ancestry-reports/native-american-dna/
Kitty/Andrea,
From what I’ve observed the various companies have a difficult time determining Native American/Indigenous dna ethnicity below a certain threshhold, especially less than 1%. Ancestry has bounced me all over from <1% Native American-North, Central, South, to zero NA/Indigenous with the August 2019 update, now with the latest I'm <1% Indigenous Cuba. My aunt is 1% Indigenous Americas-North. FTDna was showing me with <1% Eastern Asia, Middle East, North African, and now shows <1% Middle East – Anatolia, Armenia, and Mesopotania.
My aunt and all of her family are all enrolled Cherokee and we have many dna matches on Ancestry who's Cherokee lineage is well documented.
You are right, the Cherokee Princess fable is very common, but having odd trace amounts of ethnicity such as Eastern Asia, North African and Eastern European or other unexplained results suggests to me that doing the other side of Genealogy, namely following the paper trail where possible, could lead to Native American connections.
I have matches on Ancestry who's NA percentages are a lot higher, and by looking at our family trees with common ancestors, you can see they have fewer ancestors that intermarried, preserving a greater amount of the NA dna in their line.
It's worth doing the research is all I'm saying.
Andrea, there were many Native Americans that did not end up on the Dawes Rolls for various reasons, but are on other rolls or emigration lists. It is possible there are ancestors of yours on some of these other lists.
Here is a link to Christina Berry's website which has a good article on the rolls, and a list:
https://www.allthingscherokee.com/know-im-cherokee-prove/
To bring this back around to the original subject (sorry Kitty) it is frustrating to not only have the various companies show differing ethnicity results, but even more so when it is within the same company.
Thanks,
Brian
Brian –
Thank you for all that useful information.
Andrea and Brian one other thing is if you have someone on the female only line of descent from a known or expected Native American woman then the mitochondrial haplogroup can tell you the truth. A,B,C,D, and X are the known native groups. See
https://en.wikipedia.org/wiki/Genetic_history_of_indigenous_peoples_of_the_Americas#:~:text=All%20indigenous%20Amerindian%20mtDNA%20can,%2C%20D2a%2C%20and%20D4h3a).
23andme gives you your mtDNA haplogroup. You can figure it out from the Ancestry results but not easily (I will try an blog about this soon)
Hello Kitty,
FTDna will also do a Mitochondrial and a Y dna test, and can predict various Haplogroups.
What is frustrating in my case is my great, great grandmothers who were Cherokee married white males. My great grandfather was therefore Cherokee. He married a Cherokee woman, and their children, my grandfather among them, were all Cherokee. My grandfather married a white female, and my father and aunt are Cherokee, as are their children.
So the Y dna test won’t work for me in identifying an Indigenous haplogroup, as my Indigenous Dna trail comes from my great, great grandmothers.
I have thought of the mitochondrial test, but I would need to try and find a living relative who would be a direct female descendant of my great, great grandmothers that would be willing to test at 23andme or FTDna.
FTDna has a project called the American Indian Project where members can share and collaborate. Roberta Estes is one of the Group Administrators.
Yes get an mtDNA test for a descendant of one of your grandfather’s sisters, a male is OK if his mother is in the direct female line
Pingback: Where personal DNA testing is today | Kitty Cooper's Blog